Client
desider labs
Region
Pakistan · Product Studio
Year
2018 — 2019
Discipline
Data Viz · Editorial · Design Systems
News & Survey Data Products.
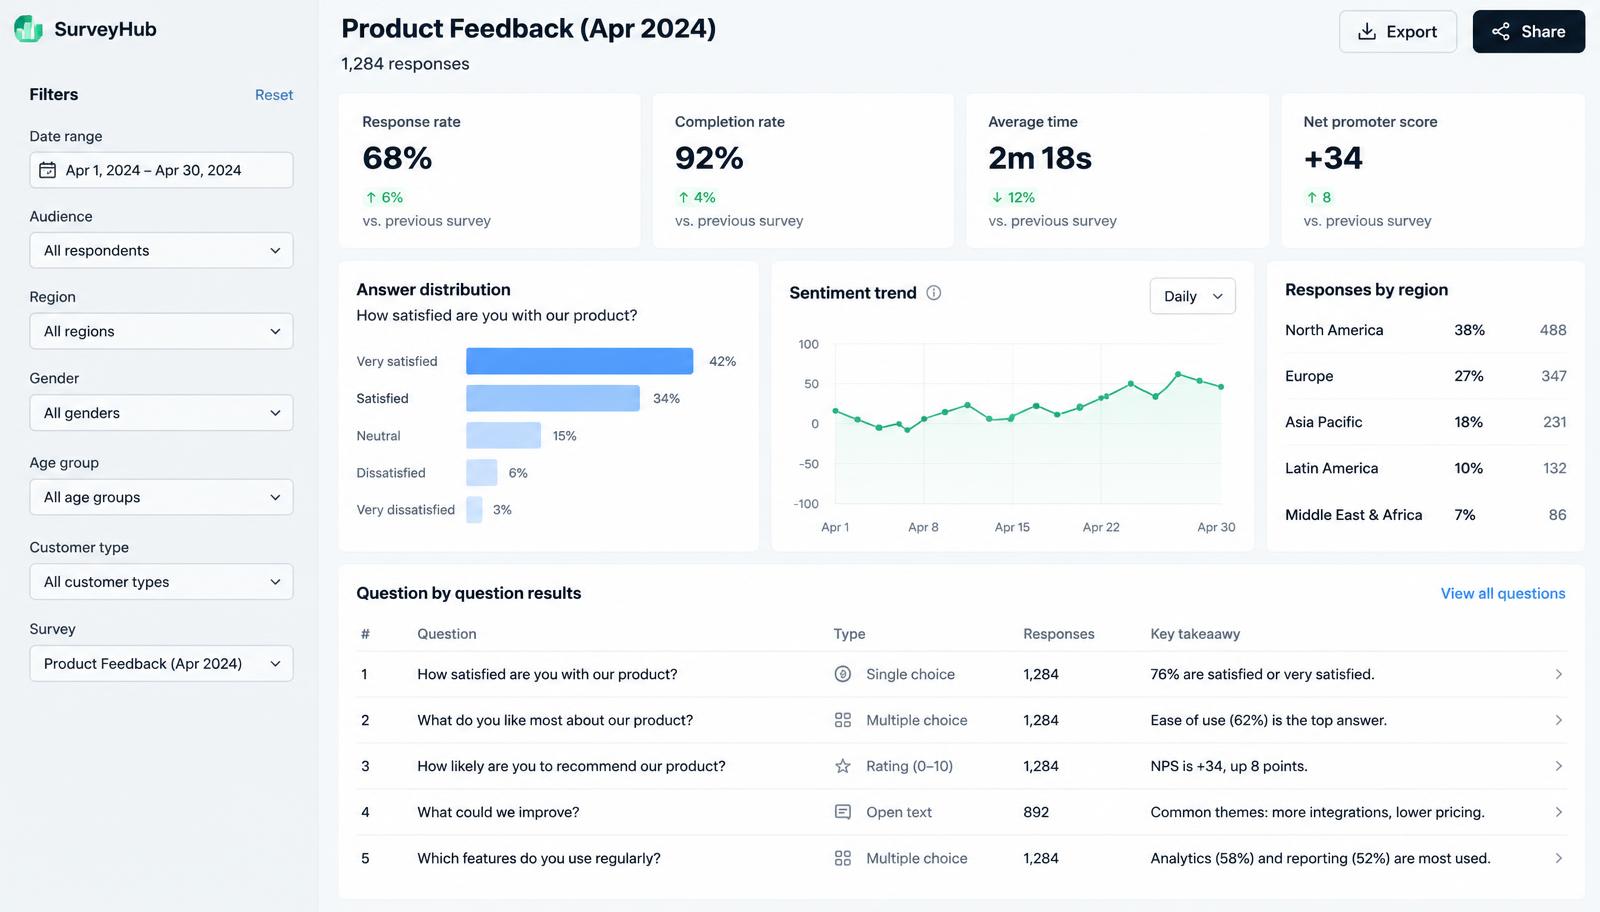
Led UX for news and survey applications plus the dashboards that made their data readable — and wrote the style guide that held them together.
The problem
Two audiences, one codebase: readers who want a story fast, and researchers who want to interrogate thousands of survey responses.
The thinking
"Give each audience its own rhythm. Editorial screens optimize for scanning and trust; analysis screens optimize for comparison and drill-down."
Process
Four moments that shaped the work.
Two products, one language
Defined shared foundations — type scale, colour logic, chart grammar — so both apps felt like one studio.
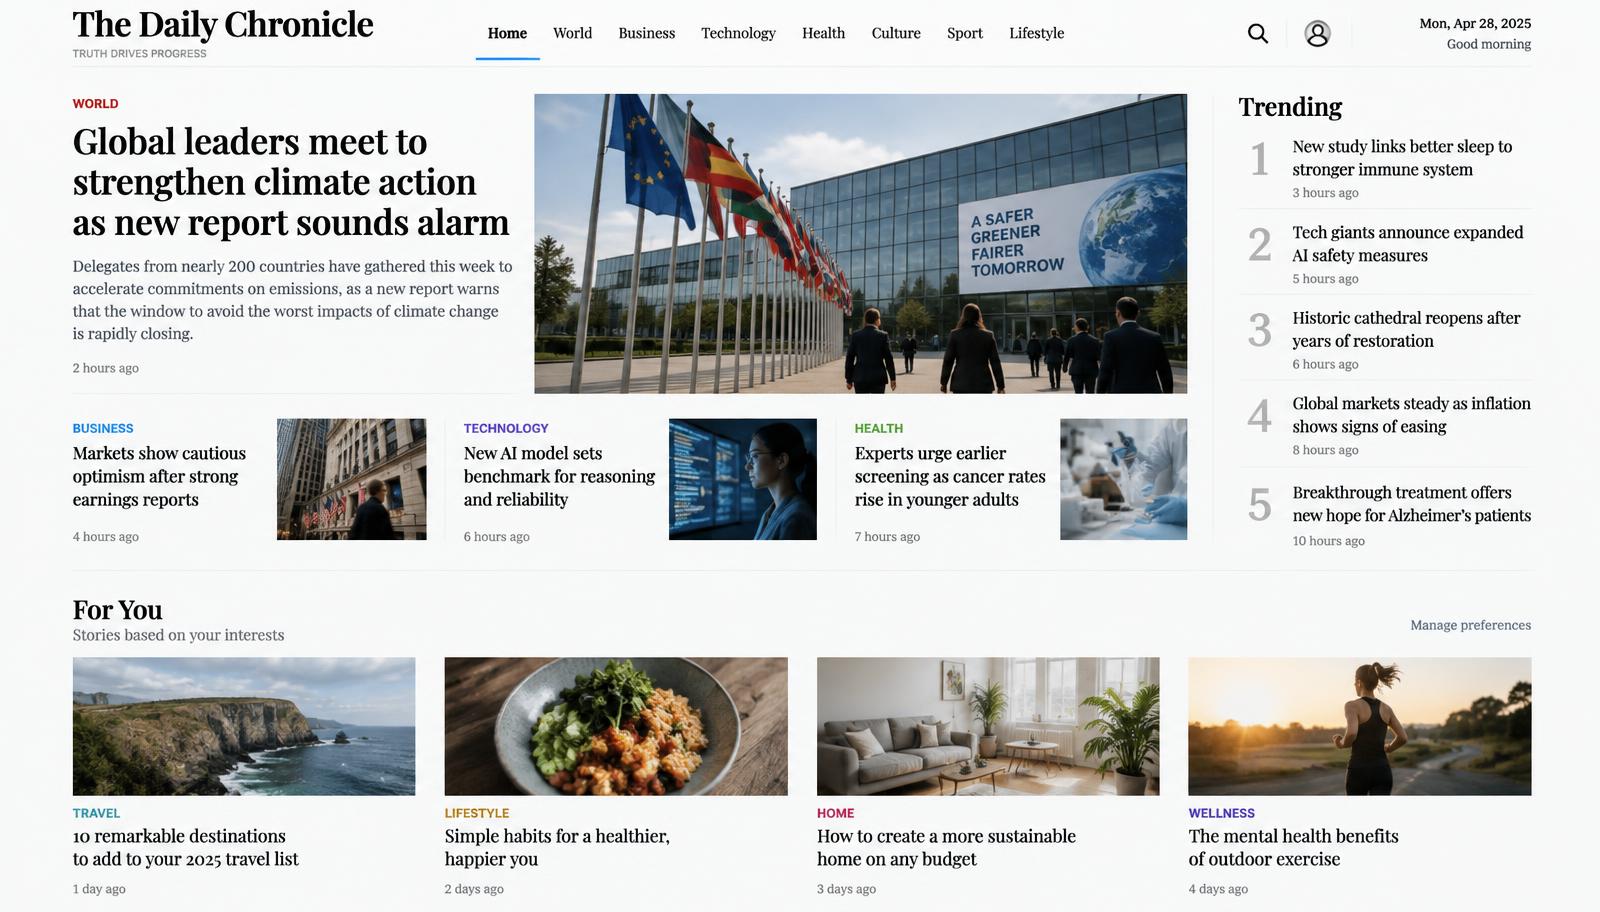
Editorial reading experience
Designed the news app around lead stories, trending lists and a personalised feed that respects reading speed.
Survey analysis dashboards
Designed cross-tab filters, answer distributions and sentiment trends so findings surface without exports.
Guidelines that outlived me
Wrote the style guide and design guidelines the team kept using after the projects shipped.
Outcome
2
Products designed in parallel — news and survey
1
Shared design system and style guide authored
15+
Chart and dashboard patterns standardised
“Data becomes useful the moment it becomes readable.”
Glimpses
A look at the work.
Next case study
AI Sportswear Customization →
An AI-driven team-order system that turns 90 minutes of spreadsheets into a 4-minute conversation — with production, ledger, and invoicing built in.